Pinescripts
Pro Pine Script Indicator for TradingView | Custom Technical Analysis Tool | Trading Strategy Script | Instant Download
$36.00
-
DetailsThis comes with 2 versions 1, 2 and a bonus Reversal Bands. Version 2 is fixed history (last image). Get the Reversal Bands when buying.
Full Explanation of the Indicator.
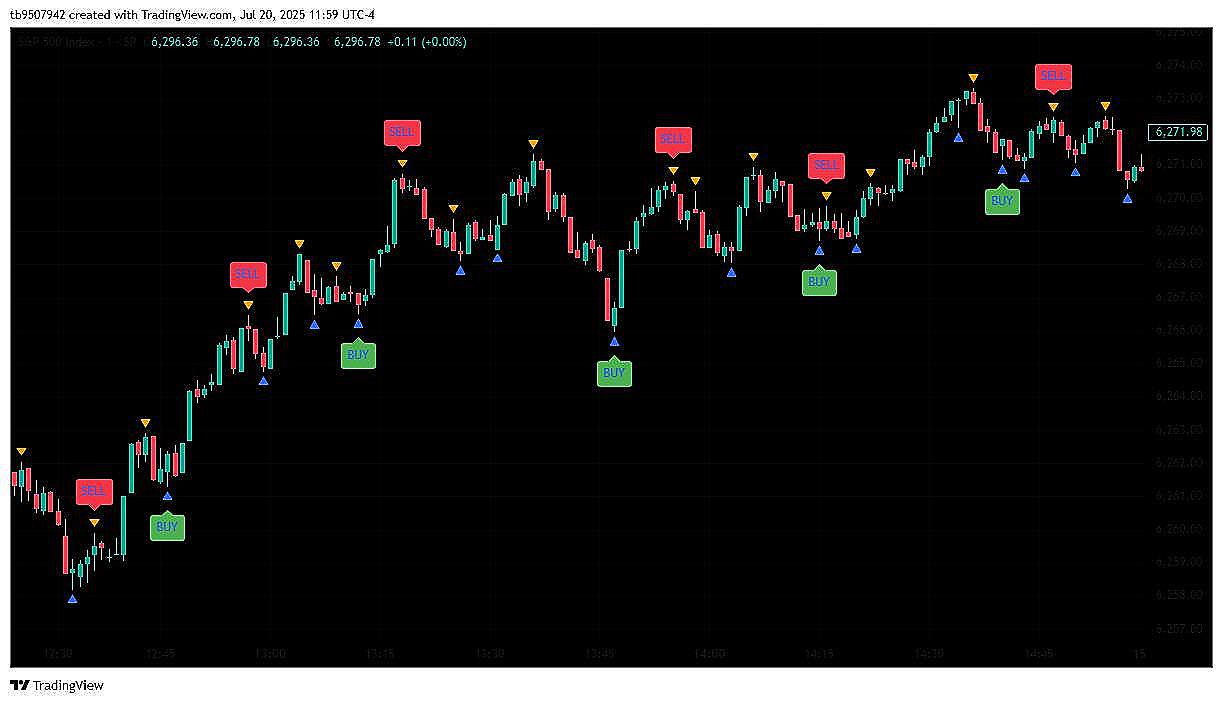
What This Indicator Does
This indicator combines two things:
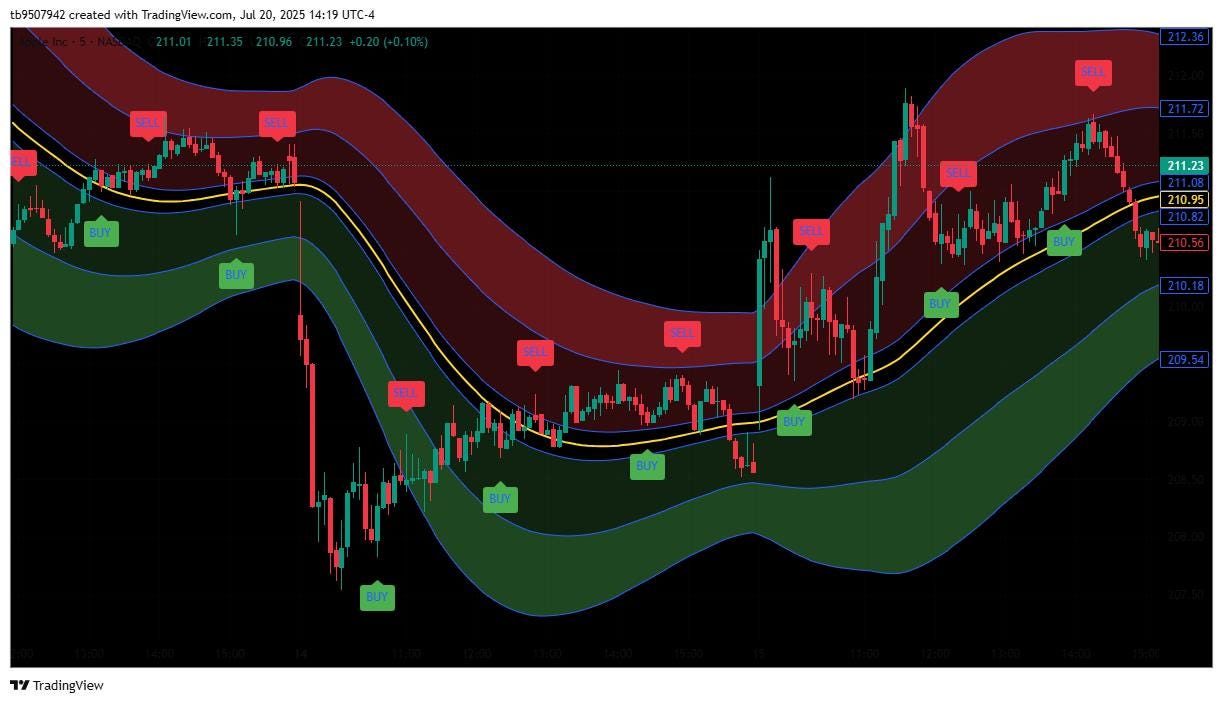
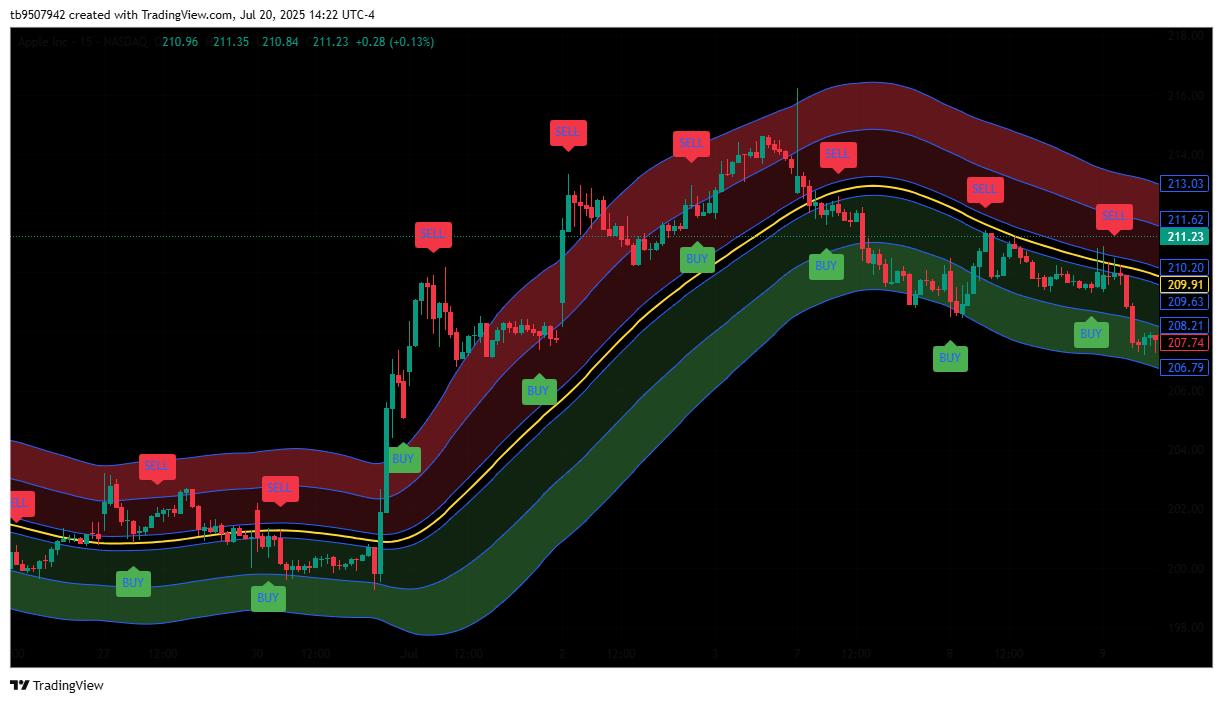
Moving Average Filter (MA):
A moving average line that changes color to show if the price trend is going up, down, or sideways.
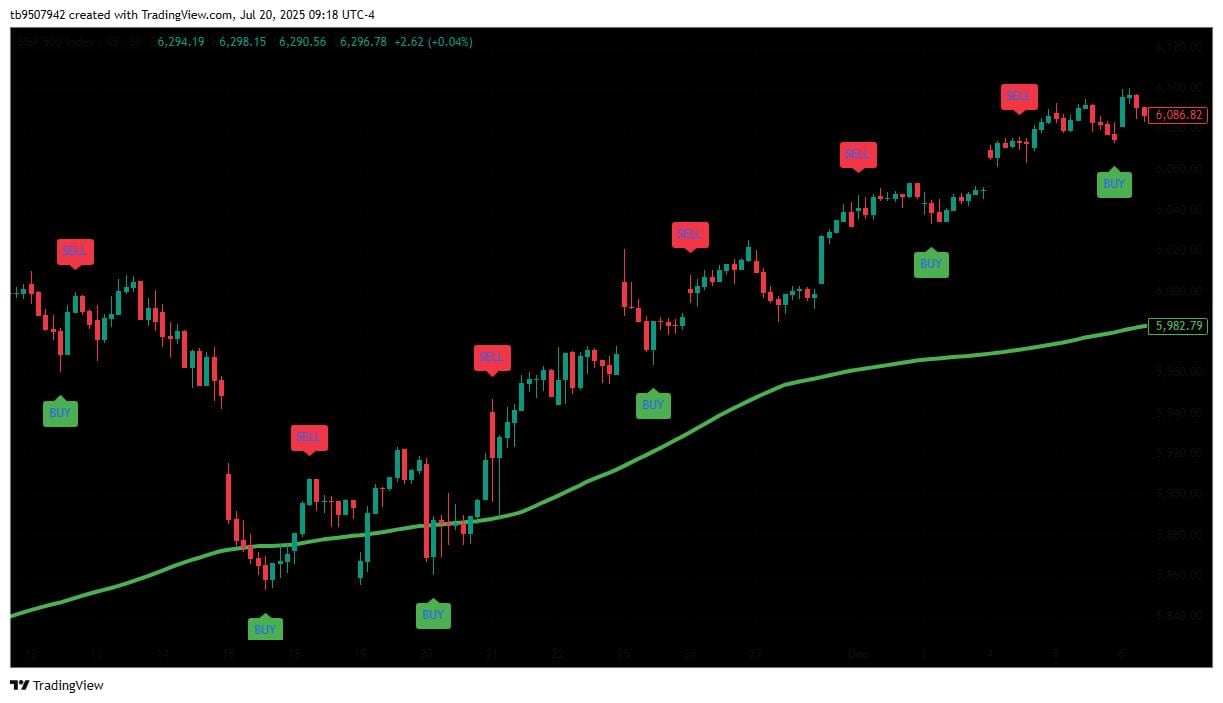
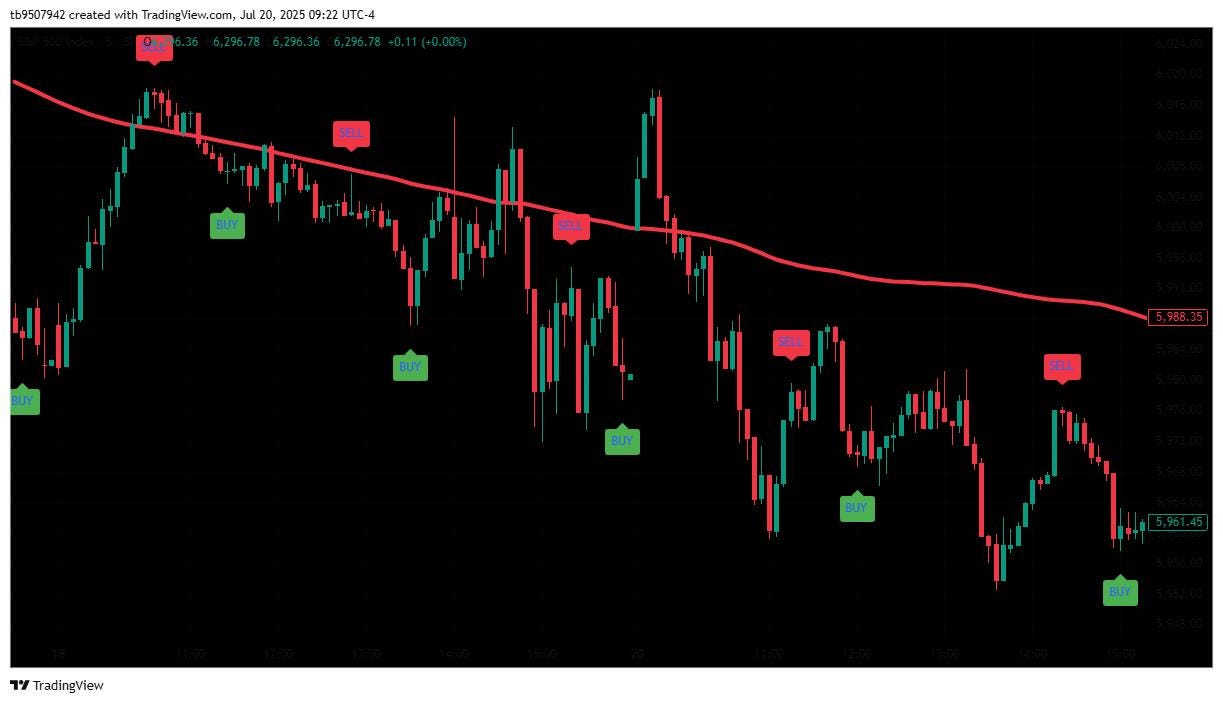
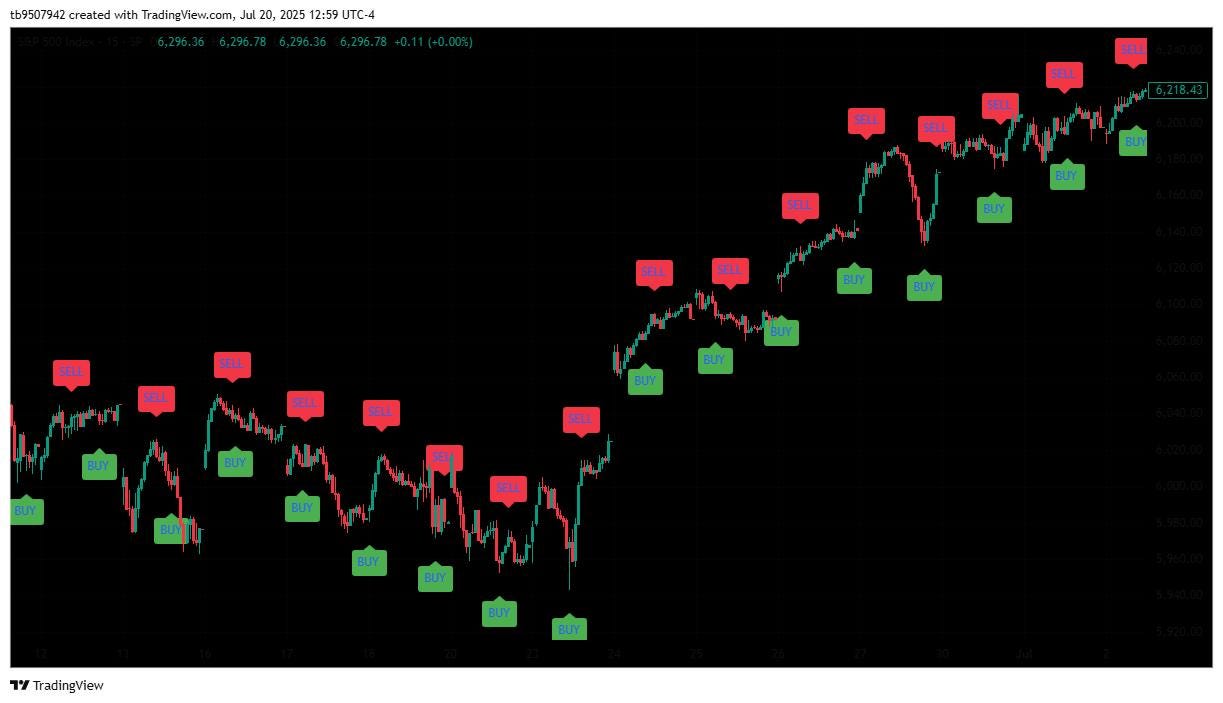
Pivot Swing High / Swing Low Signals:
It detects local highs and lows (called pivots or swings) where the price might reverse, and then marks these points with buy (green) or sell (red) arrows.
How It Works — Step By Step
1. Moving Average (MA)
The indicator calculates a simple moving average (SMA) of the closing prices for a given number of bars (period).
The color of the MA line depends on how the average is moving:
Buy: If the MA is rising compared to its previous value — indicating an upward trend.
Sell: If the MA is falling compared to its previous value — indicating a downward trend.
Neutral: If the MA hasn’t changed — indicating no clear trend.
2. Pivot Swing High / Swing Low Detection
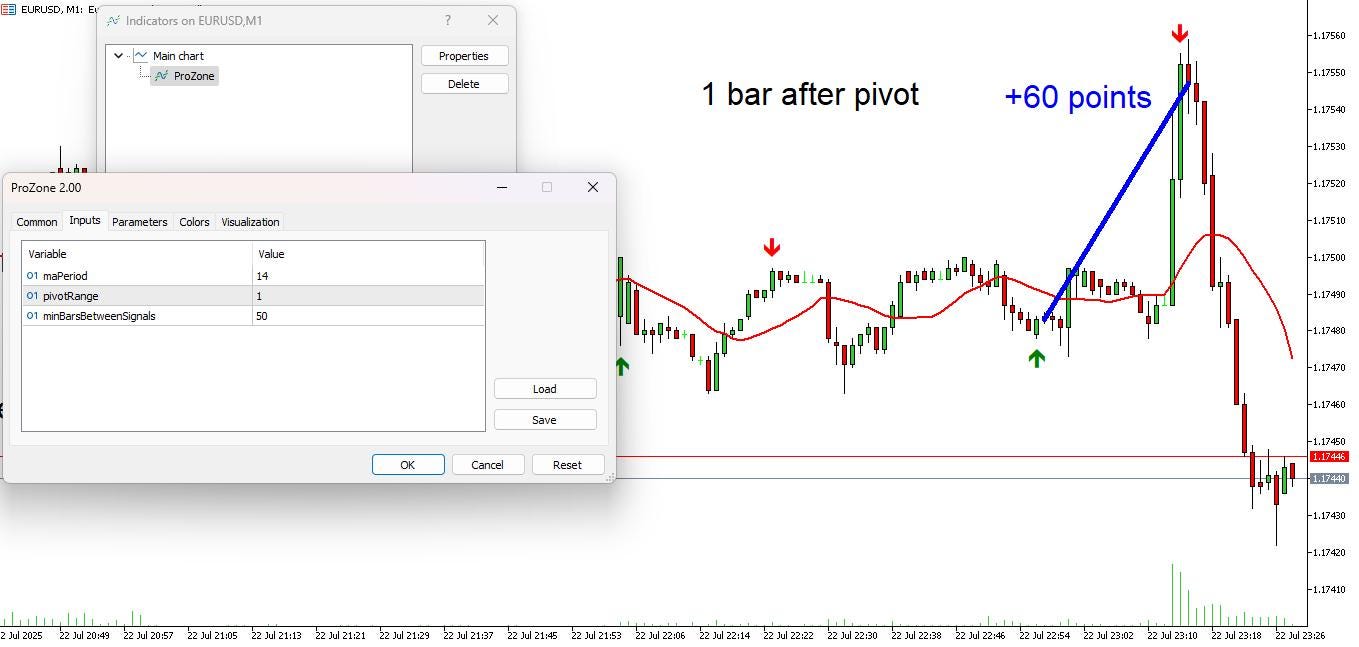
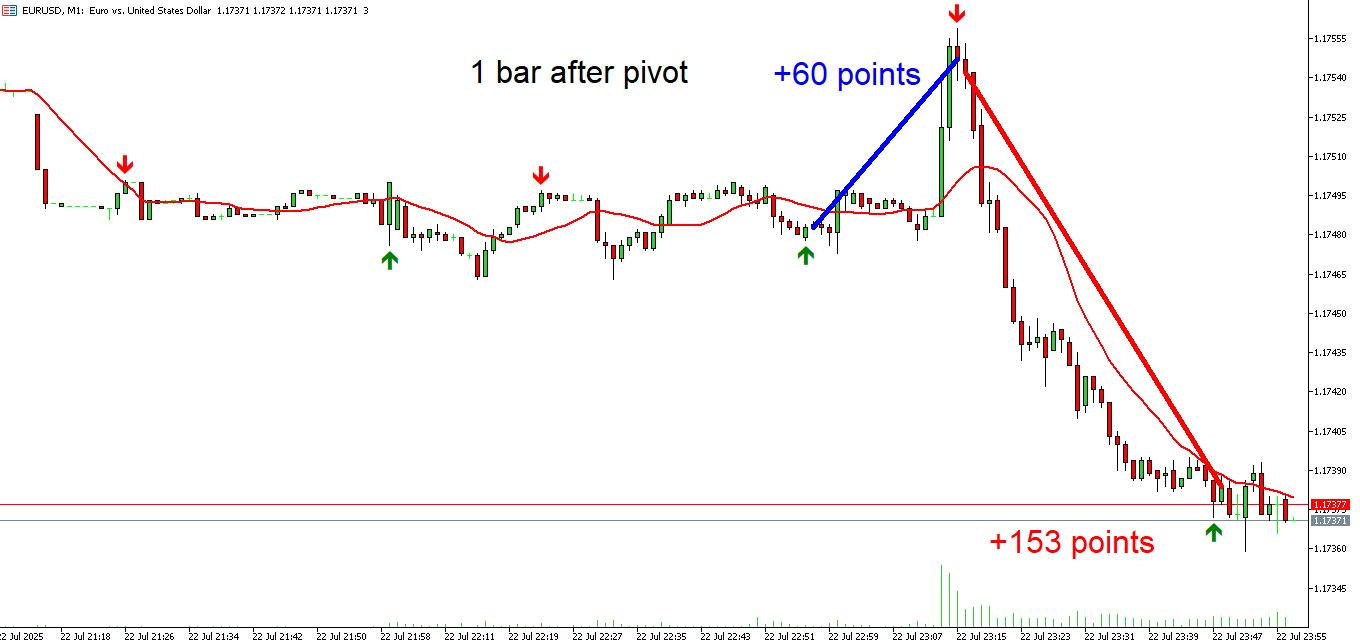
The indicator looks for Swing Highs and Swing Lows, also called pivots and will print a signal on the Pivot lookback bars. So, if you want less delay and more accuracy then put less Pivot lookback bars and more Min bars between signals
It checks if a candle’s high (for swing high) or low (for swing low) is the highest or lowest compared to a number of bars before and after it.
This "number of bars before and after" is controlled by the pivot range (or pivot lookback).
For example, if pivot range = 50 Min bars between signals and 2 Pivot lookback bars
A swing high is a candle where the high is greater than the highs of the previous 50 Min bars between signals and the next 2 Pivot lookback bars.
Similarly, a swing low is a candle where the low is lower than the lows of the previous 50 Min bars between signals and the next 2 Pivot lookback bars.
When Do Signals Appear?
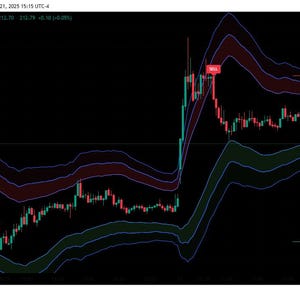
Buy Signal (Green Arrow):
Plotted below the candle where a swing low is confirmed. It suggests the price may start rising.
Sell Signal (Red Arrow):
Plotted above the candle where a swing high is confirmed. It suggests the price may start falling.
How to Adjust the Indicator
MA Period:
Controls how many bars the moving average covers.
Smaller period = more sensitive to price changes, faster reaction.
Larger period = smoother MA, slower reaction.
Pivot Range:
Controls how many bars before and after are compared to detect swings.
Larger pivot range = stronger, more reliable swing signals but more delay.
Smaller pivot range = faster signals but potentially more false signals.
Min Bars Between Signals:
Ensures the indicator does not produce signals too close to each other, reducing clutter and false signals.
How to Use It
Follow the Trend Look at the moving average. If it’s up, the market is trending upward; if down, downward.
Watch for Arrows:
A green arrow below a candle means a confirmed swing low — a potential buying opportunity.
A red arrow above a candle means a confirmed swing high — a potential selling opportunity.
Combine for Better Decisions:
Prefer buy signals when the MA is green (uptrend).
Prefer sell signals when the MA is red (downtrend).
Adjust Settings:
Tune MA period and pivot range to your preferred sensitivity and timeframe.
Related Products